

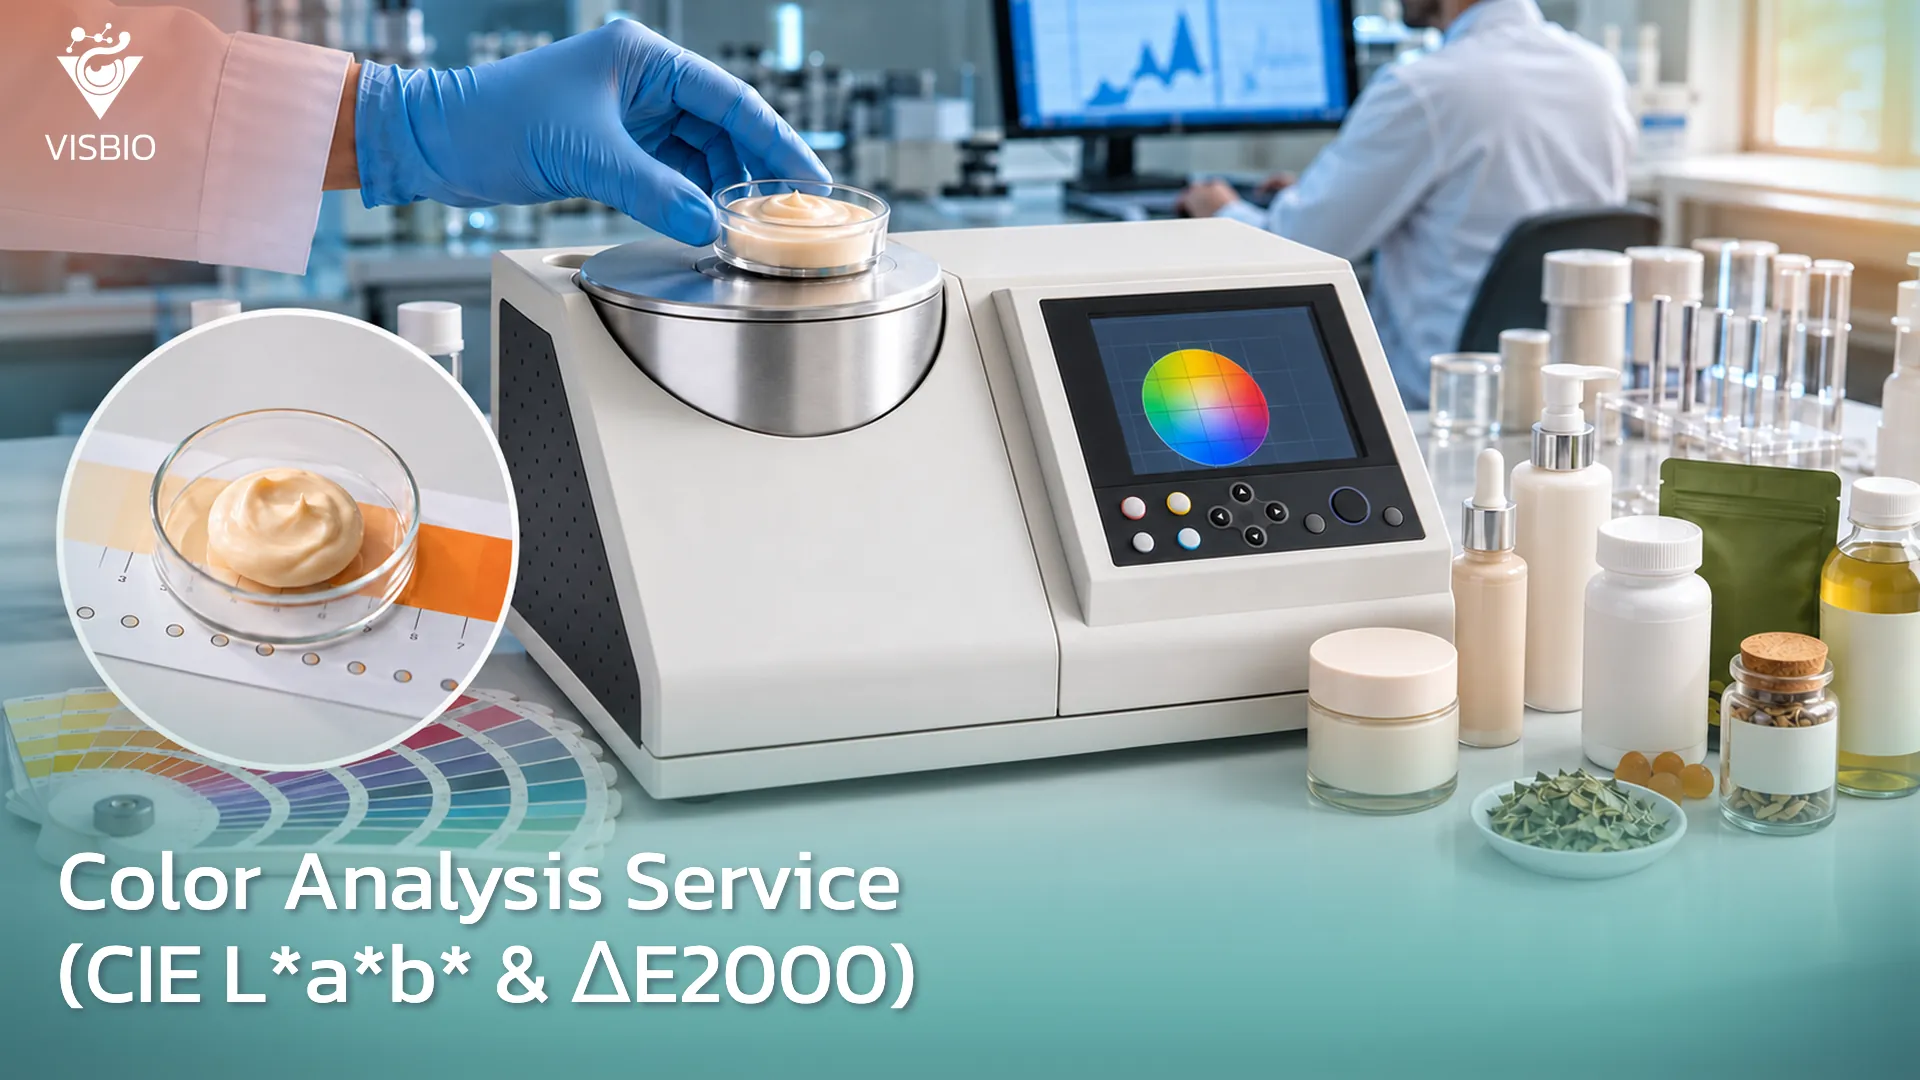
Color analysis is the conversion of a sample’s color into numbers that can be compared. It uses the CIE L*a*b* color space, which describes a sample’s lightness, its green–red component and its blue–yellow component, while ΔE2000 shows how much the colors of two samples differ. Once color becomes a number, manufacturers can set limits, release batches and track color change throughout shelf life without relying on the human eye alone.
In Thailand’s health and beauty industry, when goods are refused by buyers or trading houses in the destination country, the cause is often not efficacy or safety but a parameter that looks minor: color consistency. Brand owners, contract manufacturers (OEM) and factory owners all face the same situation, because the human eye adapts to color changes that happen gradually, whereas a spectrophotometer does not. Color deviations are therefore often found when the buyer at the destination inspects the goods, not when quality control releases the batch.
Exporters to Japan, Korea, Europe and China have to meet color-difference limits set by business-to-business (B2B) buyers. Some buyers write limits into their trade agreements, for example ΔE2000 no more than 2.0 for skincare products and no more than 1.0 for eye and lip color cosmetics, with the actual figures depending on each buyer. In dietary supplements and beverages, some buyers require L*, a*, b* and ΔE values to be stated on the Certificate of Analysis (COA) for every batch. Confirming color numerically before batch release therefore costs clearly less than a recall, the rejection of a whole batch or the loss of a key account.
VISBIO Laboratory provides quantitative color measurement in the internationally used CIE L*a*b* color space and calculates color difference with the CIEDE2000 formula (ΔE2000). The service can be used in formulation development, batch release and color monitoring during stability testing. In addition to color analysis, the laboratory offers stability testing and product compatibility testing for the health and beauty industry.
Why color analysis tells several stories at once
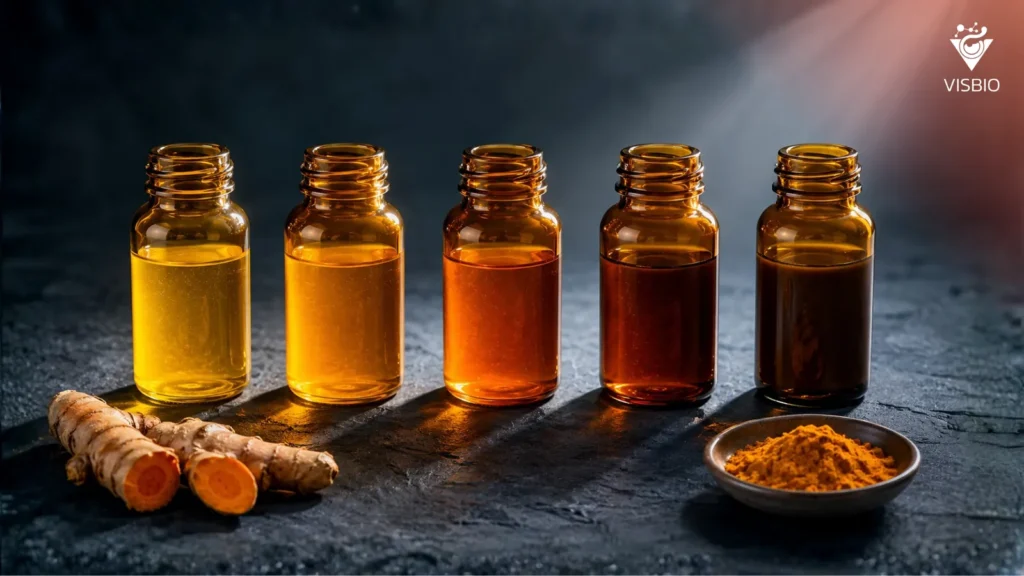
Product color is an indirect indicator of degradation taking place inside the product. In cosmetics and herbal extracts, a color change often means that bioactive compounds are degrading, such as curcuminoids in turmeric, which absorb ultraviolet A (UV-A) light. Research has reported that curcumin may lose more than half of its color within 24 hours when exposed to high-intensity pulsed light (Zhang et al., 2023). Anthocyanins in mangosteen and Riceberry rice are sensitive to pH and temperature; their degradation follows first-order kinetics and depends on temperature (Enaru et al., 2021).
In beverages and dietary supplements, browning often results from the Maillard reaction or from the oxidation of light-sensitive oils and vitamins. In oils and balms, a rising b* value (yellowness) is often associated with a rising peroxide value (PV), so color serves as an early warning of rancidity before consumers can detect it by smell.
From a regulatory perspective, appearance, including color, is one of the items in the specification that manufacturers under the Cosmetic Act B.E. 2558 (2015) and the Herbal Products Act B.E. 2562 (2019) use for quality control, and for some product types it is information submitted to the Thai Food and Drug Administration (Thai FDA). If the color of the actual product does not meet the specification, this is a quality defect. Export markets inspect even more strictly, so verifiable numerical evidence from an external laboratory is an important risk-management tool.
Principles of color analysis in CIE L*a*b* and the meaning of ΔE2000
The CIE L*a*b* system calculates color from the spectral reflectance of opaque samples, or the spectral transmittance of clear samples, across the 380–780 nm wavelength range, and converts it into values on three axes designed so that numerical distances approximate human color perception. The L* axis represents lightness (0 = black to 100 = white), the a* axis the green–red direction and the b* axis the blue–yellow direction.
The value used to judge the difference between two samples is the color difference, ΔE. Its newest form, and the one weighted most closely to human perception, is ΔE2000, calculated with the CIEDE2000 formula (Sharma et al., 2005). A commonly used guide to interpretation is:
- ΔE2000 up to 1.0: a difference that almost no observer can see
- ΔE2000 from 1.0 to 2.0: a difference that only trained observers can detect
- ΔE2000 from 2.0 to 3.5: a visible difference, often used as the ceiling for commercial acceptance
- ΔE2000 above 3.5: a clearly visible change
- ΔE2000 above 5.0: a large change, which should not be seen in stability test samples
These ranges are general guidance, not fixed limits. Actual acceptance criteria should be set in each product’s specification, for example ΔE2000 no more than 5.0 throughout the stability test.
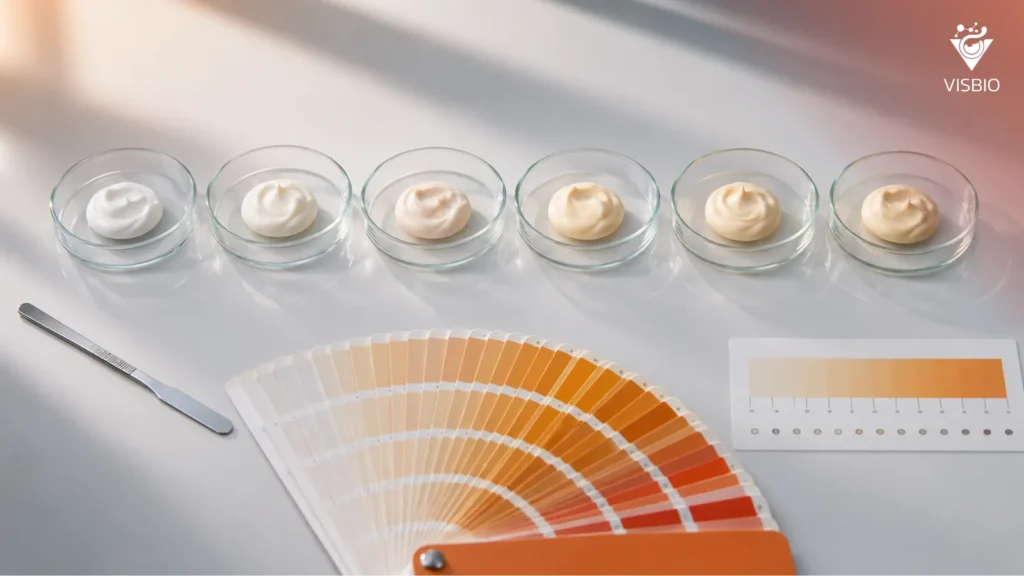
VISBIO Laboratory measures color in-house with a spectrophotometer, in either of two modes depending on the sample: reflectance for creams, powders and solids, and transmittance for clear liquids. Alongside quantitative measurement, a qualitative visual color description against a color reference chart is used in parallel, especially at raw-material receipt and when communicating with raw-material suppliers. VISBIO Laboratory’s color assessment therefore covers both dimensions: quantitative results that can be verified, and qualitative descriptions that every party in the supply chain can share.
Scope of VISBIO Laboratory's color analysis service
VISBIO Laboratory’s color analysis service covers three groups of samples:
- Cosmetics: creams, lotions, serums, gels, toners, treatment oils, lipsticks, foundations, shampoos and shower creams
- Dietary supplements and beverages: functional drinks, ready-to-drink beverages, syrups, powdered drink mixes, capsules, softgels, jellies, gummies and powder blends
- Active ingredients and extracts: powdered extracts, liquid extracts, viscous extracts, dried herbs, essential oils, coconut oil and Riceberry rice
Creams, powders and solids are measured in reflectance mode, while clear liquids such as toners, clear beverages and clear liquid extracts are measured in transmittance mode. Results are reported as quantitative values: L*, a*, b*, chroma (C*), hue angle (h°), ΔE2000, ΔL*, Δa* and Δb*. Clients can choose a single-point report for batch release or a trend report over time for use alongside a stability study.
Using color analysis results
Color analysis results can be used at several stages of a product’s life:
- Research and development: compare prototype formulas using L*a*b* values, and test the effect of changing a raw-material supplier.
- Pre-launch: set the baseline for the specification and the acceptable ΔE limit for batch release.
- Commercial production: combine with stability studies to confirm that the product keeps the color stated on the label throughout its shelf life, and support label claims that require verifiable evidence.
- Export: attach to the Certificate of Analysis for buyers who require color values, and support incoming inspection by buyers at the destination.
Frequently asked questions about color analysis
What is color analysis?
Color analysis converts the color of a sample into numbers in the CIE L*a*b* color space and uses ΔE2000 to express the color difference between two samples. These numbers are used to set limits, release batches and track color change throughout shelf life.
What do L*, a* and b* mean?
L* is lightness, from 0 (black) to 100 (white); a* is the green–red component; and b* is the blue–yellow component. All three are calculated from the reflectance or transmittance of the sample across 380–780 nm.
Why measure color with an instrument when the eye can already see it?
The human eye adapts to gradual color change, so small differences between batches or during storage can go unnoticed. An instrument does not adapt, so it gives numbers that can be compared across batches and over time.
What does a color change say about product quality?
A color change is an indirect sign of degradation, for example the breakdown of curcuminoids or anthocyanins in herbal extracts, browning from the Maillard reaction in beverages and dietary supplements, or a rising b* value in oil-based products, which is often associated with a higher peroxide value.
What types of samples does VISBIO Laboratory accept for color analysis?
Three groups: cosmetics such as creams, serums, lipsticks and foundations; dietary supplements and beverages such as ready-to-drink beverages, powdered drink mixes, capsules and gummies; and active ingredients and extracts such as powdered extracts, liquid extracts and essential oils. Creams, powders and solids are measured in reflectance mode, and clear liquids in transmittance mode.
What values does the color analysis report include?
The report includes L*, a*, b*, C*, h°, ΔE2000, ΔL*, Δa* and Δb*. Clients can choose between a single-point report for batch release and a trend report over time for use alongside a stability study.
References:
- Zhang, H. A., Pratap-Singh, A., & Kitts, D. D. (2023). Effect of pulsed light on curcumin chemical stability and antioxidant capacity. PLOS ONE, 18(9), e0291000. https://doi.org/10.1371/journal.pone.0291000
- Enaru, B., Drețcanu, G., Pop, T. D., Stǎnilǎ, A., & Diaconeasa, Z. (2021). Anthocyanins: Factors affecting their stability and degradation. Antioxidants, 10(12), 1967. https://doi.org/10.3390/antiox10121967
- Sharma, G., Wu, W., & Dalal, E. N. (2005). The CIEDE2000 color-difference formula: Implementation notes, supplementary test data, and mathematical observations. Color Research & Application, 30(1), 21–30. https://doi.org/10.1002/col.20070
- Royal Thai Government Gazette. (2015, September 8). Cosmetic Act B.E. 2558 (2015). Royal Thai Government Gazette, 132(86 Kor), 1–22.
- Royal Thai Government Gazette. (2019, April 30). Herbal Products Act B.E. 2562 (2019). Royal Thai Government Gazette, 136(56 Kor), 116–161.