

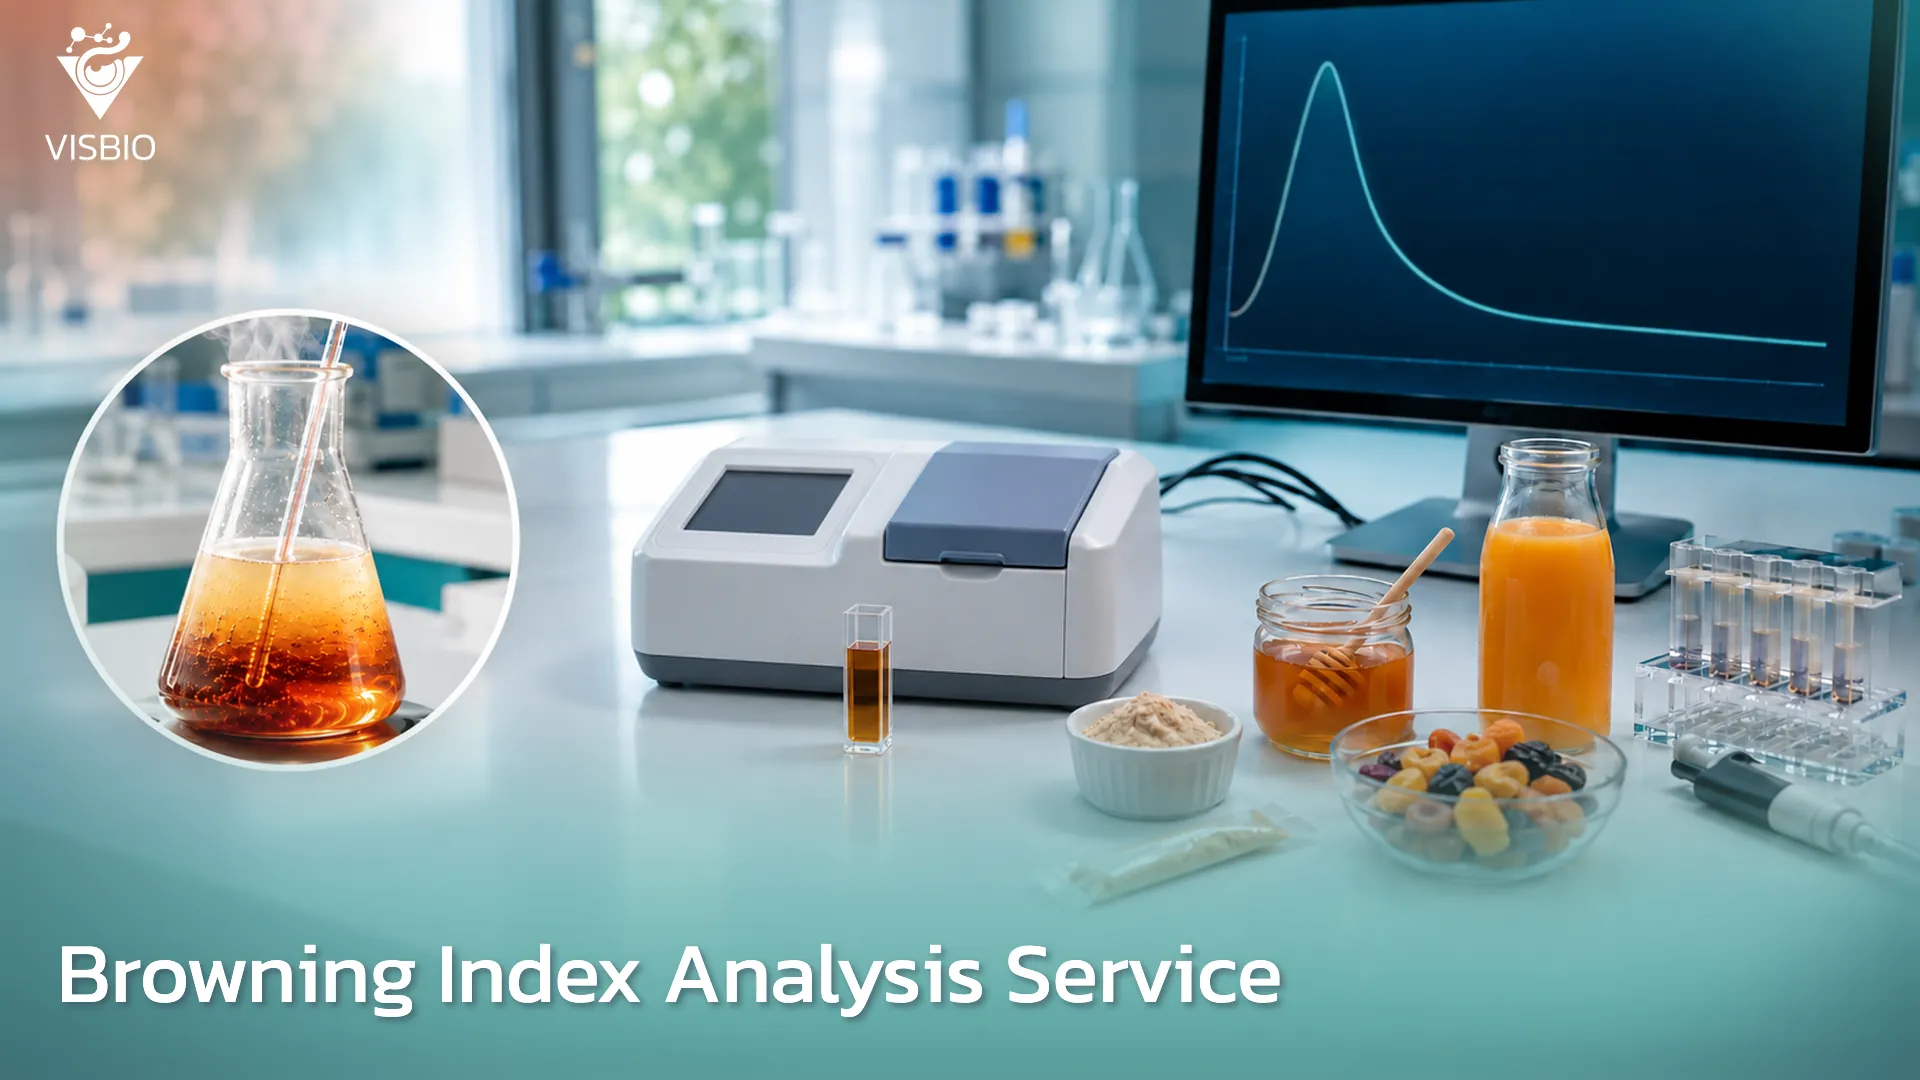
The browning index is a number that shows how much browning a product has undergone. It is used to track color changes caused by chemical reactions during processing and storage. The index is obtained by two main methods: measuring the absorbance of a sample solution at a wavelength of 420 nanometers, or calculating it from CIE L*a*b* color values. Once the color change becomes a number, manufacturers can compare formulas, set limits and track color throughout shelf life without relying on the human eye alone.
In beverages, fruit juices, dried fruit, herbal extract powders and foods that contain both sugars and amino acids, browning over time is a common quality problem that affects brand credibility. A product that is light and clear when made may turn dark brown after 6–12 months of storage, until consumers suspect that it has spoiled or is close to expiry. In export markets, where containers pass through high temperatures during shipping, browning that happens faster than expected may lead an importer to reject an entire batch.
Browning is caused by several chemical reactions. The main mechanism is the Maillard reaction between reducing sugars, such as glucose, fructose and lactose, and amino acids, which occurs given heat, time and suitable conditions. This reaction produces both brown pigments called melanoidins and volatile aroma compounds, which may be desirable, such as the aroma of roasted coffee or baked cake, or undesirable, such as a burnt note in fruit juice stored for a long time. The second mechanism is the degradation of ascorbic acid (vitamin C), which produces dark-colored compounds. The third is caramelization, the breakdown of sugars at high temperatures, which does not require amino acids. All three mechanisms occur without enzymes and are therefore grouped together as non-enzymatic browning, as distinct from enzymatic browning in fresh fruit that has been cut or crushed. Knowing which mechanism causes the browning is key information for solving the problem in the formula.
VISBIO Laboratory measures the browning index of beverages, fruit juices, dried fruit, herbal extract powders, powdered drink mixes, sugar-containing confectionery, honey, syrups and other food products by measuring CIE L*a*b* color values with a colorimeter and calculating the index. Absorbance measurement at 420 nanometers with a UV-visible spectrophotometer (UV-Vis) is carried out in collaboration with partner laboratories.
Why the browning index reveals problems before consumers see them
During formulation, controlling browning requires balancing several factors. Reducing sugars in the formula, such as glucose syrup and honey, drive the Maillard reaction more strongly than a non-reducing sugar such as sucrose, so products high in glucose syrup brown faster. In acidic beverages, however, some of the sucrose may be broken down into glucose and fructose during storage. pH also has a direct effect: the Maillard reaction speeds up as pH rises and slows down below pH 4. Adjusting the pH of the formula is therefore one way to slow the Maillard reaction, but its effect on taste must be considered, and in products that contain vitamin C, the degradation of vitamin C can still cause browning even at low pH.
In products that contain ascorbic acid, browning is more complex, because vitamin C breaks down into dark-colored compounds on its own when exposed to heat and oxygen. In beverages labeled as fortified with vitamin C, or fruit juices with natural vitamin C such as orange juice, browning control therefore relies on choosing a more stable form of vitamin C, adding supporting antioxidants and using packaging that protects against light and oxygen. Comparing which approach works requires quantitative browning index data, often viewed together with analysis of the vitamin C content remaining in the product.
In dried fruit and herbal extract powders, browning can begin during drying if the temperature is too high, and it continues during storage when the powder absorbs moisture or is kept at high temperatures. In dried foods, the Maillard reaction is fastest when aw is in the intermediate range, not when the powder is very dry. Controlling the moisture content and aw of powders therefore also helps slow browning. In spray drying, a high inlet air temperature, for example 180–200 °C, may raise the initial browning index of powders made from extracts high in sugars and amino acids. Lowering the inlet temperature or switching to freeze drying are options that reduce browning at the source.
From a marketing perspective, color is the first thing consumers use to judge quality. Fruit juice that has turned brown makes consumers think the product is close to expiry, even before the date on the label. Premium products in clear packaging, where consumers can see the product directly, are especially sensitive to this problem. Tracking the browning index throughout shelf life is therefore a tool for protecting sales on the shelf.
From a quality control perspective, appearance, including color, is quality data that the manufacturer sets in the product specification. A product whose color has moved away from the specification fails its quality criteria. Setting an initial browning index in the specification therefore helps confirm that the product still meets its defined quality.
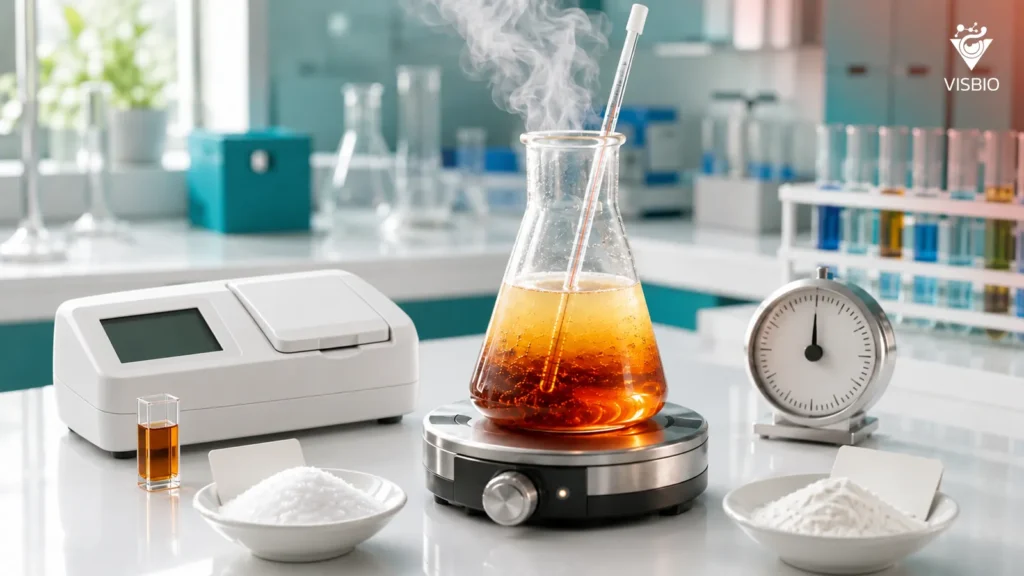
Principles of browning index measurement: absorbance or calculation from color values
In the scientific literature, the term “browning index” is used for two kinds of value, depending on the measurement method. The two methods give numbers with different meanings and ranges, so a value from one method cannot be compared directly with a value from the other, and the report must always state the method used.
Method 1: Absorbance at 420 nanometers
This method suits liquid samples such as fruit juices, beverages, honey and syrups, as well as powders that dissolve in water or can be extracted into a solution. The principle is to measure the absorbance of the sample solution by UV-visible spectrophotometry according to the Beer–Lambert law, which states that absorbance (A) is directly proportional to the concentration of the light-absorbing substance (c) and the path length of light through the solution (l), as in the equation A = εcl. When measured within the linear range, absorbance reflects the amount of brown pigments in the solution and can therefore be used as a comparative index, even though it does not give the concentration of any single compound, because the brown pigments are a mixture of many substances.
The wavelength commonly used is 420 nanometers, which lies in the violet-to-blue range of light that brown pigments absorb, making the sample look yellow to brown to the eye. Melanoidins have no distinct absorption peak in the visible range; their absorbance increases steadily as the wavelength gets shorter. The 420-nanometer wavelength is therefore chosen by convention so that results can be compared, not because it is the point of maximum absorbance. Some methods use other wavelengths, such as 440 nanometers, so using the same wavelength as the reference method is an important condition for comparable results.
Turbid samples must be cleared before measurement, because suspended particles scatter light and make the reading falsely high. One method used for citrus juices is to centrifuge out the pulp, dilute with ethanol so that the remaining particles settle, and then filter before measurement, which reduces interference from carotenoid pigments (Meydav et al., 1977). Results are reported as absorbance against a blank of the same solvent, together with the dilution factor and the optical path length of the cuvette.
Method 2: Calculation from CIE L*a*b* color values
This method suits solid samples and powders whose color can be measured directly without extraction, such as dried fruit, powdered drink mixes and extract powders. The principle is to measure the color values L* (lightness), a* (green–red) and b* (blue–yellow) with a colorimeter, then calculate the chromaticity coordinates and convert them into an index using the formula of Buera et al. (1986). This index expresses the brown color purity of the sample: the higher the value, the more pronounced the brown color. The method uses the same data set as color analysis, so it can be reported together with the L*, a* and b* values and the color difference (ΔE) in a single report.
| Item | Method 1: Absorbance at 420 nanometers | Method 2: Calculation from CIE L*a*b* color values |
|---|---|---|
| Suitable samples | Liquids, and powders that dissolve or can be extracted into a solution | Solids, powders and dried fruit whose color can be measured directly |
| Sample preparation | Centrifuge, filter or dilute until clear | Measure the sample as it is |
| Reported value | Absorbance, with the dilution factor | Index calculated from color values, together with L*, a* and b* |
| Caution | Turbidity and other pigments can interfere | The natural color of the raw material, such as the yellow of carotenoids, also affects the value |
Whichever method is used, values measured with the same method and the same sample preparation can be compared across batches and over time, which makes them suitable for tracking color change during stability studies of foods and beverages. Values from different methods, or from different sample preparations, should not be compared directly.
Scope of VISBIO Laboratory's browning index measurement service
VISBIO Laboratory’s service covers four sample groups:
- Fruit juices and beverages: orange juice, pineapple juice, grape juice, mango juice, blended fruit juices, cold-brew teas and herbal drinks
- Honey and sugar products: floral honey, herbal honey, maple syrup, herbal syrups and processed sugars
- Dried fruit and extract powders: dried fruit, fruit pastes, herbal extract powders, powdered drink mixes and bakery premixes
- Dried meat and protein products: dried meat, protein powders and high-protein snacks
The report states the measurement method used and gives the mean and standard deviation of replicate measurements. For stability studies, it shows the quantitative change over time relative to the starting point (time zero, T0). Clients can choose between a single measurement for batch release and repeated measurements throughout shelf life.
Using browning index results
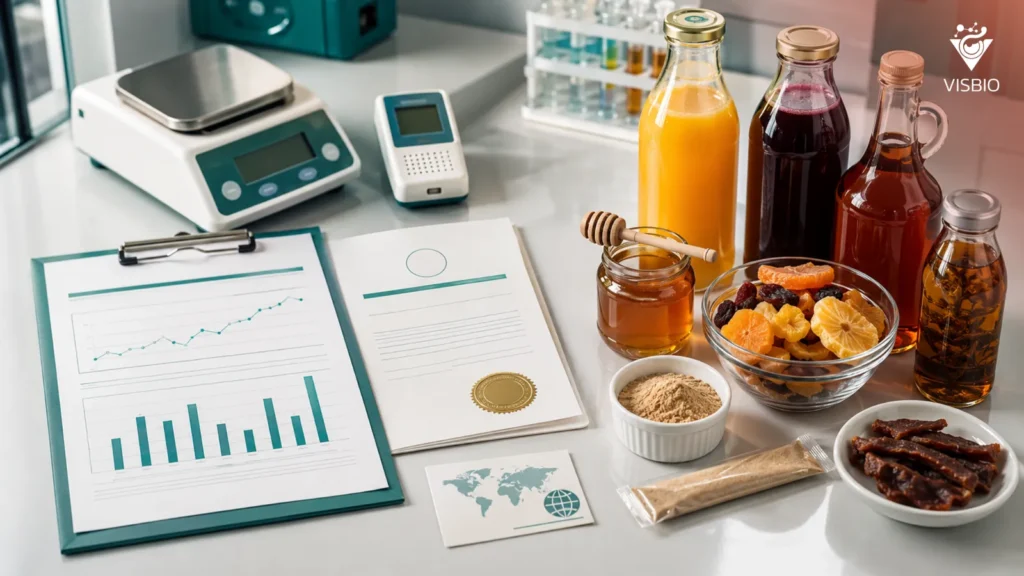
Browning index results are useful at several stages of a product’s life:
- Research and development: to select sugar types, amino acid sources and processing conditions that reduce browning, to test the effectiveness of antioxidants and pH adjusters, and to compare packaging that protects against light and oxygen
- Raw material supplier selection: to check the quality of incoming fruit juice concentrates and extracts. Juice concentrates evaporated at high temperatures may have a high initial value and make the finished product change color faster.
- Pre-launch: as the baseline for the specification, and to set the acceptable change in browning index (ΔBI) for batch release
- Commercial production: as a batch release criterion that catches processing abnormalities that may accelerate color change
- Stability studies: together with real-time stability and accelerated stability studies, to assess how long the product’s color will stay within its specified limits
- Export: as an attachment to the certificate of analysis (COA) for buyers who specify a browning index or a color grade in their trade agreements
Frequently asked questions about the browning index
What is the browning index?
The browning index is a number that shows how much browning a product has undergone. It is used to track color changes caused by chemical reactions during processing and storage, and to set limits for batch release.
What makes beverages and extract powders turn brown?
There are three main mechanisms: the Maillard reaction between reducing sugars and amino acids, the degradation of vitamin C, and the caramelization of sugars at high temperatures. Heat, time, pH, the type of sugar and the moisture of the powder determine how quickly the color changes.
How many ways are there to measure the browning index?
There are two main methods. The first measures the absorbance of a sample solution at a wavelength of 420 nanometers and suits liquids. The second calculates the index from CIE L*a*b* color values and suits solids and powders. Values from the two methods have different meanings and ranges, so they cannot be compared directly.
Why do fruit juices with vitamin C turn brown easily?
Vitamin C breaks down into dark-colored compounds on its own when exposed to heat and oxygen, and this happens even at low pH. Manufacturers therefore choose more stable forms of vitamin C, add antioxidants and use packaging that protects against light and oxygen, then use the browning index to confirm that these measures work.
What types of samples does VISBIO Laboratory accept for browning index measurement?
We accept four groups of samples: fruit juices and beverages; honey and sugar products; dried fruit and extract powders, such as herbal extract powders and powdered drink mixes; and dried meat and protein products, such as protein powders.
What does a browning index report include?
The report states the measurement method used and gives the mean and standard deviation of replicate measurements. For stability studies, it shows the change in the value over time relative to the starting point (T0).
References:
- Buera, M. P., Lozano, R. D., & Petriella, C. (1986). Definition of colour in the non enzymatic browning process. Die Farbe, 32/33, 318–322.
- Meydav, S., Saguy, I., & Kopelman, I. J. (1977). Browning determination in citrus products. Journal of Agricultural and Food Chemistry, 25(3), 602–604. https://doi.org/10.1021/jf60211a030